×

The Standard e-Paper
Smart Minds Choose Us
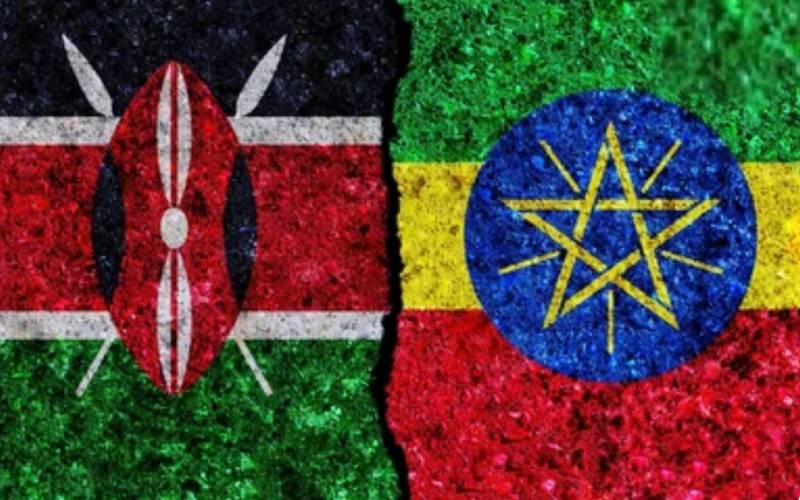
Save for the disruption of the Covid-19 pandemic, Nairobi enjoyed blissful tranquillity compared to Addis Ababa. [Courtesy]
Ethiopia’s economy in 2020 was bigger than Kenya’s.

Subscribe to our newsletter and stay updated on the latest developments and special offers!