Premium

Why many farmers struggle to access mainstream financing

Farmers learn new farming skills during Farmers Field Day in Mumias East on December 6, 2023. [Benjamin Sakwa, Standard]

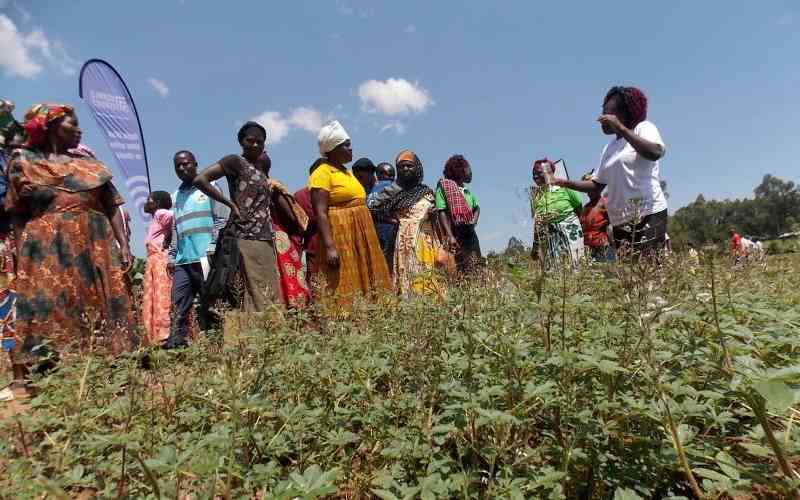
Aspects such as low penetration of smartphones among farmers contribute to the difficulties they face in accessing financing, a new survey shows. 

The survey also notes that most farmers are left out of this ecosystem because most of their transactions tend to be in hard cash. 

Additionally, farmers in the country have low financial literacy, in some cases lower than the national average.

The survey by FSD Kenya, which analysed farmers’ financial health in 2016, 2019, and 2021 as part of the larger FinAccess survey, found smartphone ownership among this population to be 19.0 per cent. 

This is while the national average is 37.2 per cent. The survey compared this to other categories where smartphone ownership among the employed was found to be 69.8 per cent, 30.1 per cent for casual labourers, 49.8 per cent for business owners, and 35.1 per cent for dependents.

According to the survey dated November 2023, cash, at 88.6 per cent, is the main mode farmers receive payments. This figure slightly dropped to 76.1 per cent in 2021.

Banks are used by a paltry 5.5 per cent while mobile money stands at 14.6 per cent. 

Cash also is the main mode of payment for farmers, at 92.6 per cent in 2016, which later dropped to 68.6 per cent. In making payments, banks take up just 2.7 per cent while mobile money increased from 2.6 per cent in 2019 to 28.7 per cent in 2021. 

“Farmers send and receive farming-related payments mainly in cash. But over a quarter send payment digitally — is it an opportunity?” the survey poses. 

Farming proceeds

According to the survey, farmers state that they don’t have as many options when it comes to financing. “Farmers perceive that they lack choice in finance for farming. They perceive they have little choice when it comes to finance for farming, but they trust in mutuals and social networks to finance,” the survey reads as it lists reinvestments from farming proceeds as the main source of financing for farmers.

This is for both male and female farmers at 25.5 and 25.8 per cent respectively. 

Other sources are friends and family, other businesses, chamas, and secret stashes to make the top five sources of financing. 

None of the top five sources shows linkages to the mainstream financial system. It is the sixth source, mobile money, that comes close to it. 

Other sources are your sale of an asset at number seven, followed by Sacco, salary, mobile bank, shopkeeper credit, and lastly bank. 

“Cash crop farmers are more likely than average to use Saccos while chamas are important for rural women,” the survey says. 

Two main reasons why these financial solutions are chosen is because: they are either the only ones available or they are fast and convenient. 

When it comes to financial health by livelihoods, farms have lower (financial health) levels compared to the rest. 

In 2016, it was 31.4 per cent compared to employed 64.7 per cent, who have the highest, with the national average then being 39.4 per cent.

In 2021, this figure stood at 17.8 per cent against the employed 43.9 per cent, casual 11.1 per cent, business owners 32.6 per cent, and dependents 10.0. The national average then on financial health level stood at 19.0 per cent. 

The survey notes that farming is an important source of livelihood and food security; but farming livelihoods are in decline. “Why? Are we financing farmers or farming?” the survey poses. 

It adds that the top goals for farmers are education and business which can be approached in two fronts: livelihoods approach for smallholder farmer households vs focus on farming.

“Farmers face high exposure to shocks, especially climate-related and low levels of digital and financial capability,” reads the FinAccess survey. 

According to the survey, farming as a source of livelihood is on the decline from 32.2 per cent in 2016 to 18.3 per cent in 2021.

This is as dependents increase from 16.3 to 21.2 per cent over the same period. 

Additionally, more people are working as casual labourers as the percentage increased from 19.5 to 30.1 over the same period.