Premium

How counties are spending your billions

Some of the top-performing counties include Ali Roba’s Mandera (83.8 per cent). [Edward Kiplimo,Standard]

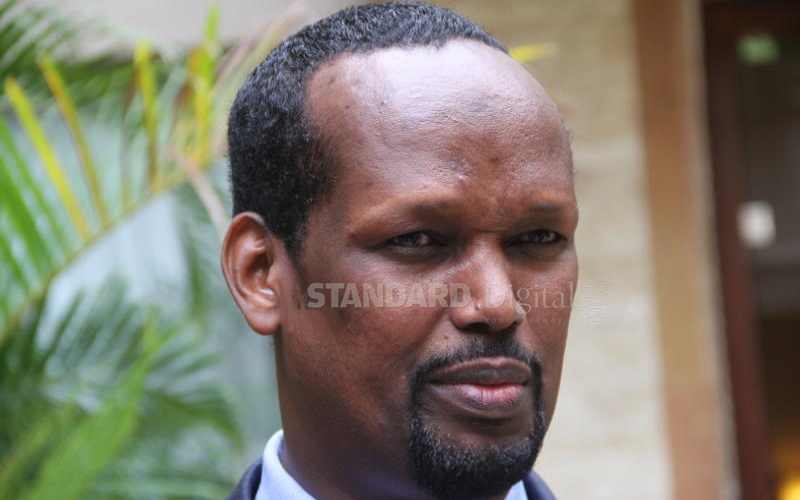
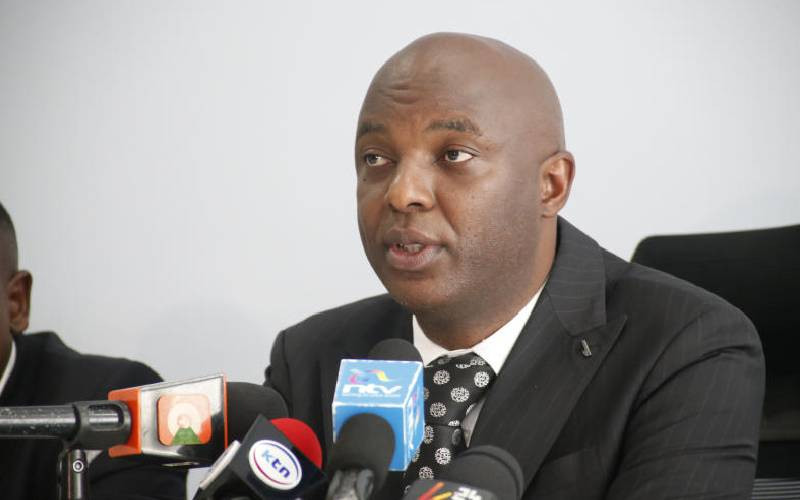
Even before Mike Sonko met his Waterloo at the Senate in December last year, his legacy as governor of Nairobi was in a free-fall.

Official data shows that the flamboyant politician, who was impeached on allegations of abuse of office, had one of the worst development records in his last financial year at the helm of City Hall.

The percentage of cash the capital city absorbed in the 12 months to June 2020 for projects that would generate cash was the lowest among the 47 counties.

And when the data is expanded to capture the last two financial years (2018-19 and 2019-20), Sonko joins a club of 10 governors who pumped little cash into capital-generating projects, yet struggled to collect their own revenue.

The Treasury, in its latest Draft Budget Policy Statement, highlighted the fact that while a lot of counties have set aside the required 30 per cent of revenue for development, they have not actually been spending it.

However, Sonko, started out well in July 2018. By the end of the financial year, he had utilised 88 per cent of the money allocated for development projects, such as markets and roads.

Then, Nairobi was the second-best performer in development spending after Narok’s Samwel Tunai, whose county absorbed 97.7 per cent of the cash it had set aside for capital-generating projects.

But things changed the following financial year, with Nairobi absorbing only 24.5 per cent of its development kitty. It was the worst performance across counties, and gave the city an average absorption rate of 56.7 per cent.

Other governors who spent the least proportion of development cash across the 2018-19 and 2019-20 financial years include Nakuru’s Lee Kinyanjui, who recorded an average absorption rate of 46.2 per cent, Lamu’s Issa Timamy (50.3 per cent), Tana River’s Godhana Dhadho (54.8 per cent) and Migori’s Okoth Obado (56.8 per cent).

Because most governors met the legal requirement to allocate at least 30 per cent of their approved budgets to development projects, the Treasury looked at actual development spending as a fraction of total county expenditure instead of the absorption rates.

Best performer

Under these parameters, Nairobi had the worst performance in the 2019-20 financial year, directing just 8.5 per cent of total spending to development.

These low absorption rates are often blamed on delays in cash disbursements from the Treasury and poor project documentation that would allow for the release of funds.

On the flipside, however, Narok spent an average of 86 per cent of the money it set aside for development projects over the two years, making it the best performer across counties.

Other top-performing counties include Ali Roba’s Mandera (83.8 per cent), Mwangi wa Iria’s Murang’a (83.3 per cent), Mohamud Ali’s Marsabit (82.4 per cent) and Hassan Joho’s Mombasa (80.2 per cent).

Murang'a Governor Mwangi wa Iria. [Wilberforce Okwiri, Standard]

Another indicator of a county’s development-consciousness is the fraction of revenue it directs towards salaries and meeting administrative costs.

The law requires that counties spend not more than 35 per cent of their total revenue on wages and other recurrent costs.

However, the Treasury warns that many counties are flouting this requirement.

“This is a worrying trend that if not tamed would greatly impact negatively on service delivery as most of the other developmental needs of the counties suffer,” it said in the 2021 Draft Budget Policy Statement.

In their defence, however, governors have previously said they are spending the money on critical needs like paying healthcare workers and teachers, many of whom are being hired for the first time under a devolved structure.

In Nairobi, however, an average of 56.5 per cent of the city’s funds went towards wages.

Counties that spent more than half their revenue on salaries in the last two financial years include Nandi (58.2 per cent), Meru (54.4 per cent), Laikipia (53.6 per cent) and Embu (53.3 per cent).

However, among those that stuck to the legal requirement are Mandera (25.9 per cent), Kwale (27.9), Nakuru (29.1 per cent), Lamu (31.2 per cent) and Narok (31.9 per cent).

Others are Tana River (32.1 per cent), Marsabit (33.9 per cent), Kilifi (33.6 per cent), Nyandarua (33.6 per cent) and Uasin Gishu (33.5 per cent).  

And when it came to generating their own revenue over the last two financial years, the counties that surpassed targets include Taita Taveta (119.8 per cent), Lamu (112.9 per cent) and Homa Bay (106.8 per cent).

Others that exceeded expectations are Machakos at 104.6 per cent, Narok at 103.5 per cent and Tana River at 101.1 per cent.

Nairobi’s own source revenue (OSR) collection hit 66 per cent of its target from an office Sonko said was struggling under cartels.

The counties that mobilised the lowest amount of their own cash include Wajir, which hit 35.2 per cent of its target, Kisii (37.2 per cent) and Nandi (45.2 per cent).

Business
Government splashes Sh100m for comfort zones in counties
Sci & Tech
Rethink data policies to increase internet access, ICT players tell State
Business
Premium Kenya leads global push to raise Sh322tr from climate taxes
By Brian Ngugi 17 hrs ago
Business
Harambee Sacco eyes Sh4bn in member's capital expansion share drive