Families spend more money on mobile phones than on fuel and electricity, according to a World Bank report.
On average, households spend Sh1,501 to mobile phone service monthly.
This is 20 per cent more than the amount allocated to home cooking fuel (Sh1,234), according to the survey done in 15 counties.
On average the households Sh986 on electricity.
Also the average monthly expenditure on mobile phones is a third of the amount that goes to house rent-Sh4,515.
The report titled, ‘Are they really being served? Assessing effective infrastructure access and quality in 15 Kenyan cities’ was authored by the World Bank’s Sumila Gulyani, Andrea Rizvi and Debabrata Talukdar.
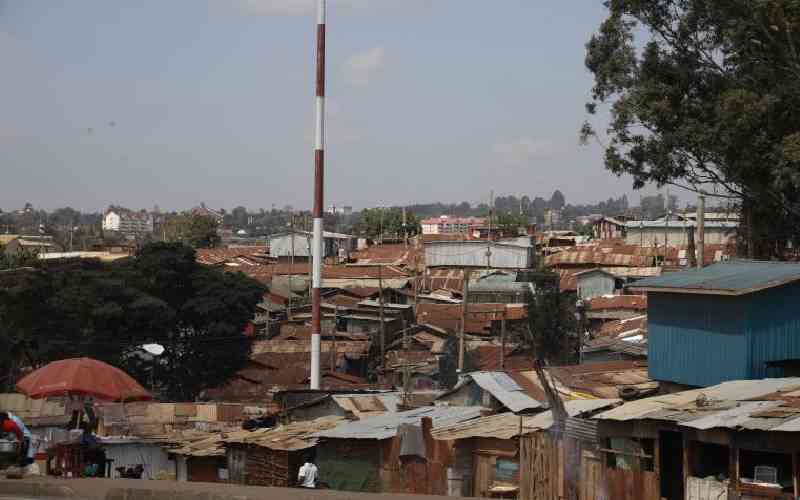
Done as part of the Urban strategy and analytics global solutions group in the social, urban, rural and resilience global practice, the survey covering 14,200 households, was carried out in Eldoret, Embu, Garissa, Kakamega, Kericho, Kisumu, Kitui, Machakos, Malindi, Mombasa, Nairobi, Naivasha, Nakuru, Nyeri and Thika.
Those interviewed were from both formal and informal (slum) settlements.
The survey shows four other services are less expensive on a monthly basis. Piped water (shared or private) averages Sh555 which is less than the amount spent on cooking fuels or rent, and about a third of that spent on phones.
Organised garbage collection, which has decent overall frequency of collection but low coverage, is even less expensive than water costing only Sh163 per month.
The survey also revealed wide variations in both the level of informality, and the level of poverty across cities.
It shows that Kisumu at 62 per cent; Mombasa 26 per cent and Nairobi 41 per cent, had a disproportionately large proportion of informal settlements, whereas in most other cities the level of informality did not exceed 10 per cent.
They are Garissa with two per cent; Kakamega six per cent; Kericho 11 per cent; Kitui six per cent; Machakos 61 per cent; Malindi five per cent; Naivasha 10 per cent; Nakuru five per cent and Nyeri five per cent.
In general, the study shows the percentage of households that were poor in monetary terms was much higher than the percentage of households that lived in informal settlements.
Stay informed. Subscribe to our newsletter
Surprisingly, there was little correlation observed between levels of informality and poverty.
Nairobi, which had one of the highest levels of informality, also benefited from the lowest level of poverty with only 43 per cent of households sampled below the poverty lines.
Poverty rates were much higher in other cities such as Kericho (85 per cent); Kitui (74 per cent) and Naivasha (71 per cent).
Overall, eight of the 15 cities had a higher proportion of poor households (less than 50 per cent) than non-poor households showing the high rates of poverty overall across urban Kenya.
The poverty rate for the sample for all 15 cities across settlement types was 51.1 per cent.
It shows the relatively high, but varying rates of poverty across cities. The two cities with the highest rates of informality (Embu and Kakamega) also have among the lowest rates of monetary poverty.
When the data was consolidated for all 15 cities, the researchers found that the proportion of the poor is very similar in formal and informal settlements across the sample (50 per cent poor in formal settlements versus 53 per cent poor in informal settlements).
Poverty levels
The difference in poverty level is not significant between formal and informal settlements overall. This implies that poverty is pervasive across Kenya, with poor households also living outside slums.
The study further shows certain patterns in infrastructure provision that are consistent across the 15 Kenyan cities.
The survey reconfirms that private delivery of mobile phone service has been a success story in urban Kenya with nine out of 10 households using mobile phones despite the relatively high costs associated with the service.
It shows that landlines are present in only a small number of households, and all households with this service also have a working mobile phone.
The survey also revealed that 93 per cent of all the households reported that public transport – bus or matatu service – is available within a 20-minute walk of their residence.
Electricity performs consistently across towns, with high levels of both nominal and effective access over 75 per cent. The survey confirms that investment over the last decade in expanding electricity coverage has been largely successful.
“The picture is less satisfactory for other essential services. Piped water is available to only 58 per cent of households, and only 55 per cent of these households use it as a dominant source of water.”
 The Standard Group Plc is a
multi-media organization with investments in media platforms spanning newspaper
print operations, television, radio broadcasting, digital and online services. The
Standard Group is recognized as a leading multi-media house in Kenya with a key
influence in matters of national and international interest.


